Learn the essentials of DPC++
Data Parallel C++ (DPC++) is a high-level language designed for data parallel programming productivity. Get the essentials, including hands-on practice, in this self-guided training course within the Intel® DevCloud for oneAPI.
Learn the Essentials of Working with DPC++
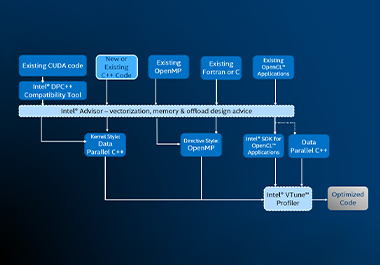
The oneAPI software model provides a comprehensive and unified portfolio of developer tools that can be used across hardware targets, including a range of performance libraries spanning several workload domains. DPC++ is based on industry standards and open specifications to encourage ecosystem collaboration and innovation and is the programming language for oneAPI.
This hands-on training experience will walk you through the process step-by-step using sample code that will teach you how to develop, test, and run your own oneAPI code within the Intel® DevCloud for oneAPI environment.
The Intel® DevCloud for oneAPI is a development sandbox where you can test and optimize your applications and solutions across a range of Intel® CPUs, GPUs, and FPGAs using oneAPI(Beta) software.
Already a member of the DevCloud? Sign in and get started
New to the DevCloud? Get access here
Who is this training for?
Developers who want to learn the basics of Data Parallel C++ for heterogeneous computing (CPU, GPU, FPGA, Accelerators, etc.)
What will I be able to do?
Run DPC++ sample code directly on the Intel® DevCloud for oneAPI using Jupyter notebooks as you read about the essential features of the language.
What will I need?
Access to the Intel® DevCloud for oneAPI, web browser to access and run Jupyter notebooks.
Course Curriculum
Module 1 - Introduction to DPC++
These initial hands-on exercises introduce the developers to DPC++ and the goal of oneAPI. In addition, it familiarizes developers with the use of Jupyter notebooks as a front-end for all training exercises. This workshop is designed to be used on the DevCloud and includes material about using Intel® DevCloud with oneAPI Products and how to submit batch jobs.
Module 2 - Data Parallel Program Structure
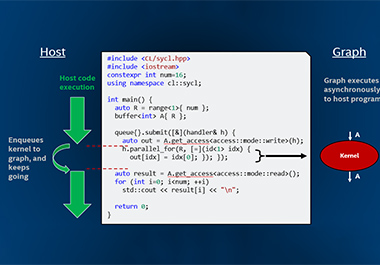
In this series of hands-on lab exercises, the developer is presented with six basic DPC++ programs that illustrate the elements of a DPC++ application. The developer will be presented with the chance to modify the source code in some exercises in order to become familiar with DPC++ program concepts.
Module 3 - Unified Shared Memory
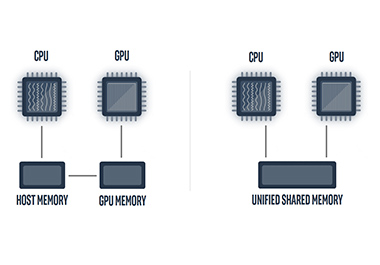
These hands-on exercises will show how to implement Unified Shared Memory (USM) in DPC++ code and also demonstrate how to solve for data dependencies for in-order and out-of-order queues.
Module 4 - DPC++ Subgroups
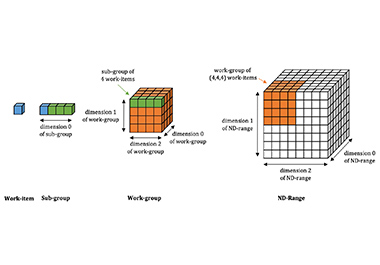
These hands-on exercises demonstrate the enhanced features of DPC++ with sub-groups. The code samples demonstrate how to implement a query for sub-group info, sub-group collectives, and sub-group shuffle operations.
Module 5 - Demonstration of Intel® Advisor
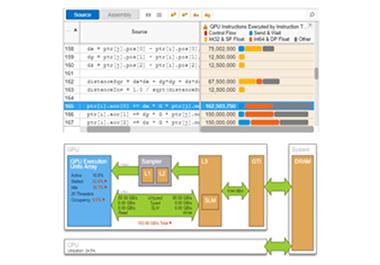
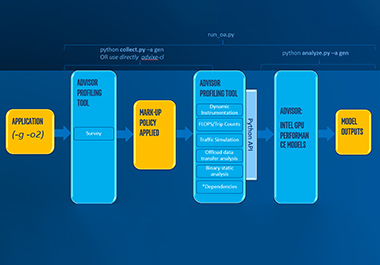
These two notebooks demonstrate various aspects of Intel® Advisor. The first Jupyter Notebook uses Intel Advisor to show performance offload opportunities of a sample application and then additional command-line options for getting for getting offload advisor results. The second Jupyter Notebook gives an example of roofline analysis and command line options for getting advisor results. Both sets of results are rendered inside of the notebook. These are exploratory and do not require any modification to code.
Module 6 - Device Offloading and Intel® VTune™ Profiler
This module provides a demonstration of device offloading and using Intel® VTune™ Profiler command-line to collect and analyze gpu_hotspots. Using the Jupyter Notebook the developer will learn how to collect performance metrics and be able to explore the results with the HTML output rendering inside of the notebook. This module is exploratory and does not require any code modification.
